What developer productivity metrics actually measure
developer experience software delivery metrics team topologies technical debt fast flow decision making culture deliberative design success triangleContact me for information about consulting and training at your company.
The MEAP for Microservices Patterns 2nd edition is now available
These days, there’s a lot of interest in measuring developer productivity. And rightly so since there’s a strong correlation between high performance software delivery and business success. Also, Microservices rules #11 is Track and improve metrics since doing so can help keep development on track. Yet at the same time, there are two problems with the so-called developer productivity metrics:
- They don’t measure productivity, at least not directly.
- The term ‘developer’ focuses attention downwards in the organization rather than upwards to the leadership, which is where the real problems with developer productivity often lie.
Read on to learn more.

What is productivity?
ChatGPT defines productivity as follows:
The productivity of a worker refers to the measure of the efficiency with which a worker produces goods or delivers services. It is typically defined as the ratio of the output generated by the worker to the input (time, effort, or resources) expended.
Measuring the productivity of a factory worker is relatively straightforward. It’s usually as simple as counting the number of widgets produced per hour. What’s more, it’s usually straightforward to assess the quality of the widgets produced.
In comparison, the productivity of a knowledge worker, such as a developer, is difficult to quantify. Developers write code and submit pull requests. But a pull request is not the same as factory worker’s widget. Pull requests vary wildly in size, complexity, quality and business value. Nevertheless, this hasn’t stopped people from trying to measure developer productivity.
DORA metrics
One set of metrics that are often used to measure developer productivity are the DORA metrics:
- Deployment frequency - how often you deploy changes to production, ideally at least once per developer per day
- Lead time for changes - how long it takes to go from code committed (git push or git merge) to running in production, ideally less than an hour
- Change failure rate - the percentage of changes that cause production issues, ideally very low
- Time to restore service - how long it takes to restore service after a production issue, ideally less than an hour
While the DORA metrics are often used to measure developer productivity, their creators describe them as follows:
DORA has identified four software delivery metrics—the four keys—that provide an effective way of measuring the outcomes of the software delivery process. DORA’s research shows that these performance metrics predict better organizational performance and well-being for team members.
Not quite the same as developer productivity, is it? Yet at the same time, the DORA metrics measure performance, and high performance as defined by the DORA metrics correlates with business success.
DevEx metrics
Another set of metrics that are described as developer productivity metrics are the Developer Experience (DevEx) metrics. These metrics overlap with and complement the DORA metrics. In particular, they assess how the teams feel about their productivity and the work environment. After all, happy developers are productive developers.
Here’s a table reproduced from DevEX: What Actually Drives Productivity that shows example DevEx metrics:
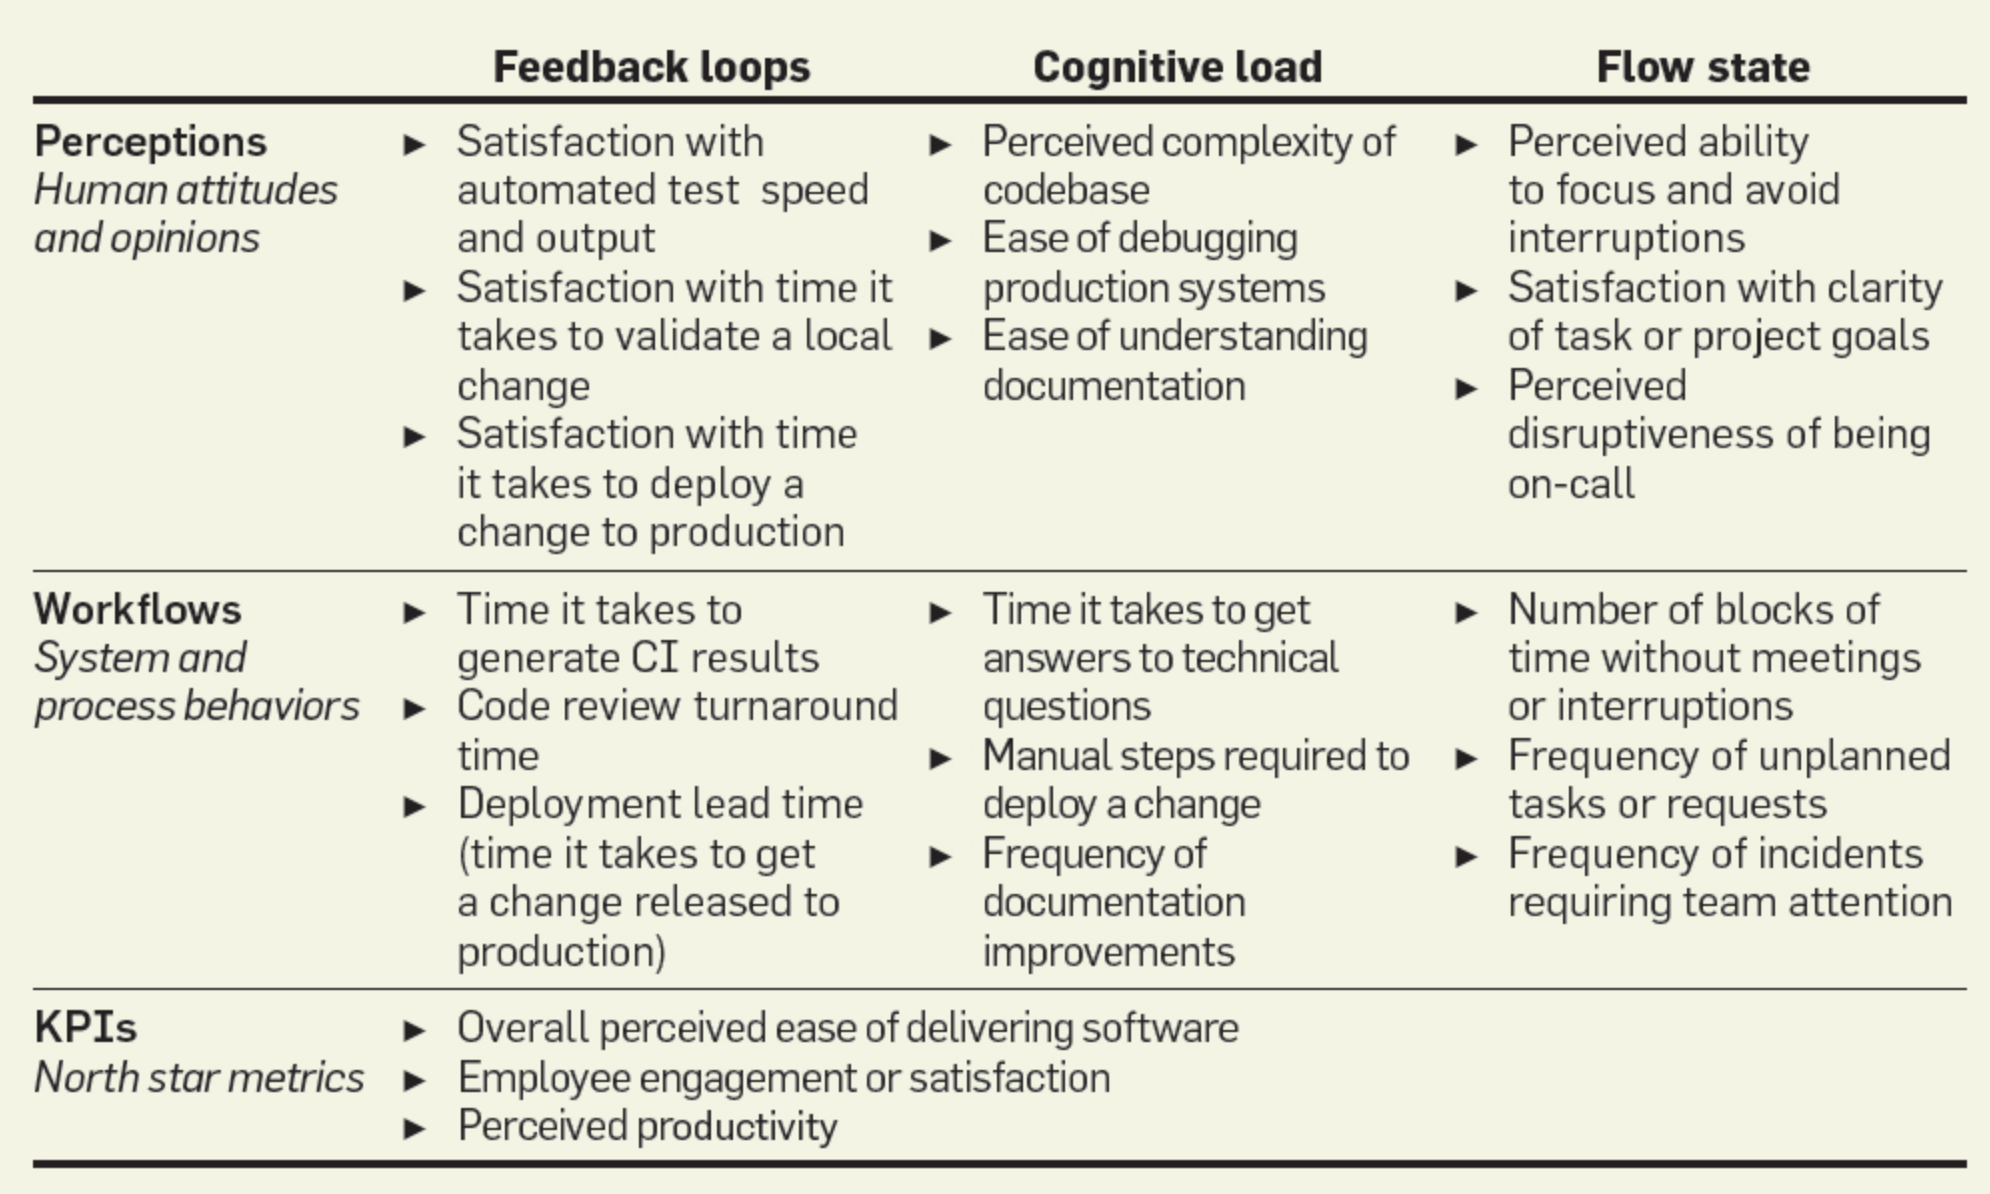
Some of these metrics overlap with the DORA metrics. Others measure how developers feel about their work. Given that developer productivity is difficult to quantify, asking a natural intelligence (aka. human being) to rate their own productivity is a reasonable approach. Yet at the same time, a developer might not know what good looks like. If they have, for example, spent their career in the Desert then they might not have any idea what it’s like to work in a Forest.
What they actually measure
The DORA and DevEx metrics both measure the frequency and duration of various software development activities. The DevEx metrics also measure how developers feel about their work. At best, the DORA and DevEx metrics measure developer productivity indirectly.
Furthermore, in many organizations, there are many aspects of software delivery that are outside the control of the developers. So much so that it seems unfair to hold them accountable for these metrics. For example, after submitting a pull request, an organization might have an elaborate review and testing process that takes weeks to complete - something the developer has no influence over.
A better name: Coefficient of sociotechnical friction?
A better way to think of these metrics is that they measure the degree of friction (or its absence) in the sociotechnical software delivery system, which consists of teams, development process, and architecture etc.
Perhaps, is a more accurate name for these metrics would be
Coefficient of sociotechnical friction
Furthermore, I’d argue what these metrics measure is not the productivity of developers but the effectiveness of engineering leadership in creating a sociotechnical system, culture and work environment where developers can be productive. Perhaps they should be:
Engineering leadership effectiveness metrics
Need help with modernizing your architecture?
I help organizations modernize safely and avoid creating a modern legacy system — a new architecture with the same old problems. If you’re planning or struggling with a modernization effort, I can help.
Learn more about my modernization and architecture advisory work →